Using the QtCreator IDE
The following instructions are tried and tested using QtCreator >= version 3.3. These instruction can be modified for most other IDEs to support the same functionality.
Installing QtCreator
Download the latest QtCreator. The minimum version we support is 3.3, then install it:
$ chmod 755 qt-creator-opensource-linux-<version>.run
$ ./qt-creator-opensource-linux-<version>.run
If you install QtCreator as root then it will be placed in /opt/qtcreator-<version>, so you can add this to your $PATH for convenience.
Loading the project
$ cd <PATH_TO_OPENTEE_REPO>
$ qtcreator project.qbs
Building
Select Build > Build project “project” or use Ctrl + B
Running and stopping
Before you can run Open-TEE from QtCreator you must first configure the /etc/opentee.conf file to point towards the build directory, this is generally in the parent directory to where the Open-TEE repo is cloned under build-project-Desktop-Debug. See Configure Runtime Environment for the details.
Open-TEE provides numerous sample applications so you must explicitly select which one you wish to run from the project menu on the bottom left.
Start with the opentee-engine which starts the main framework:
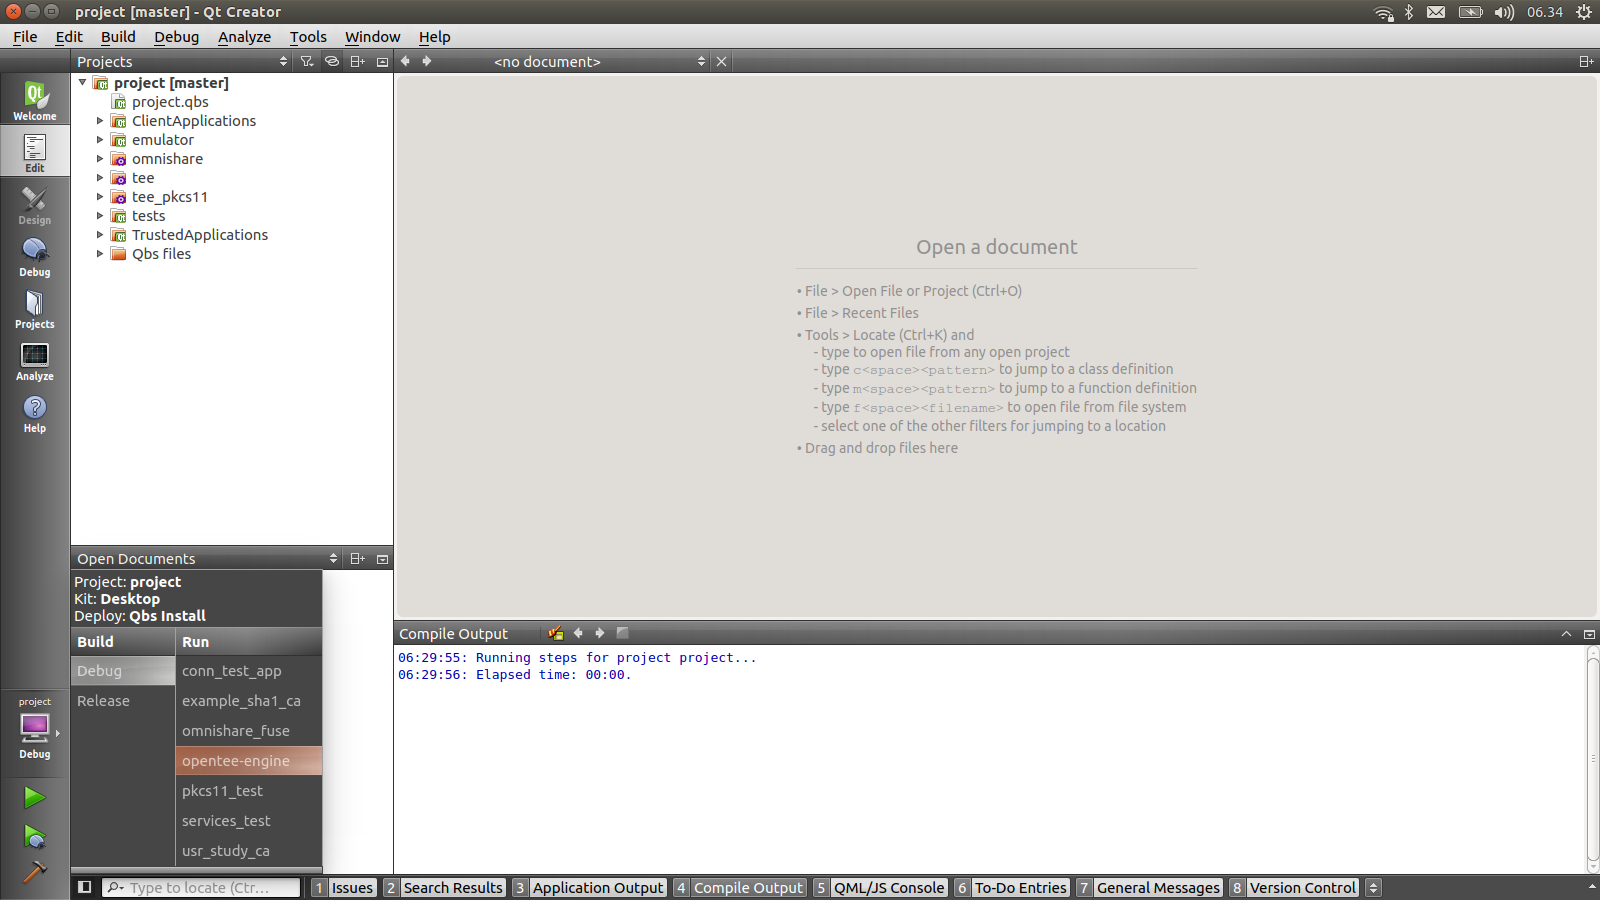
Then press play to start it running
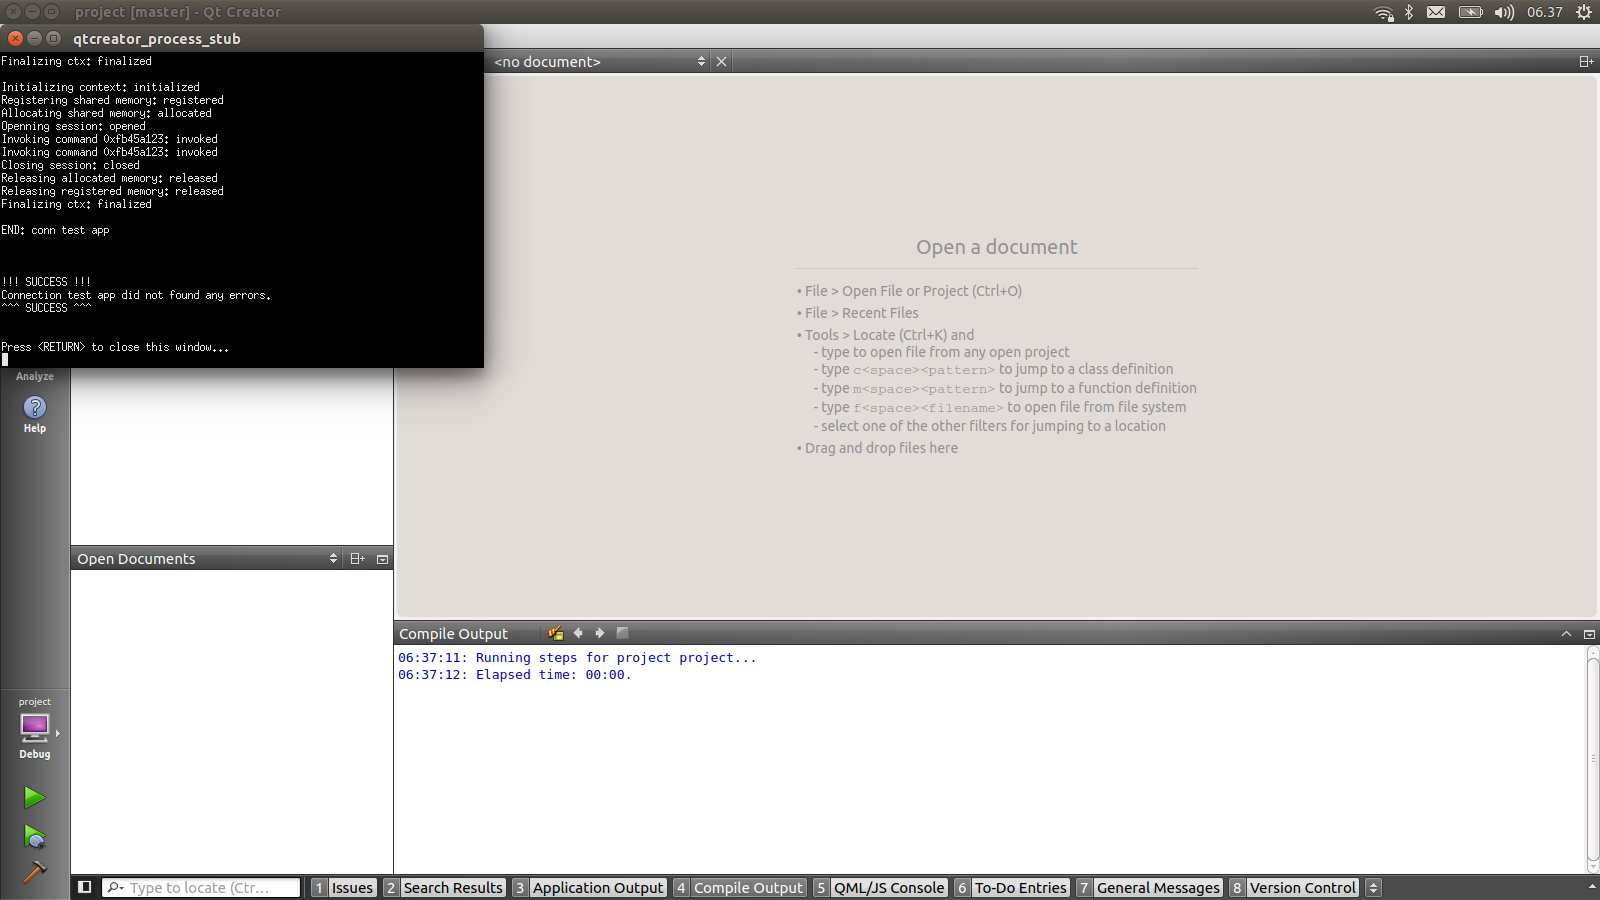
Once that is running you can start any of the sample CAs in the same way e.g. conn_test_app:
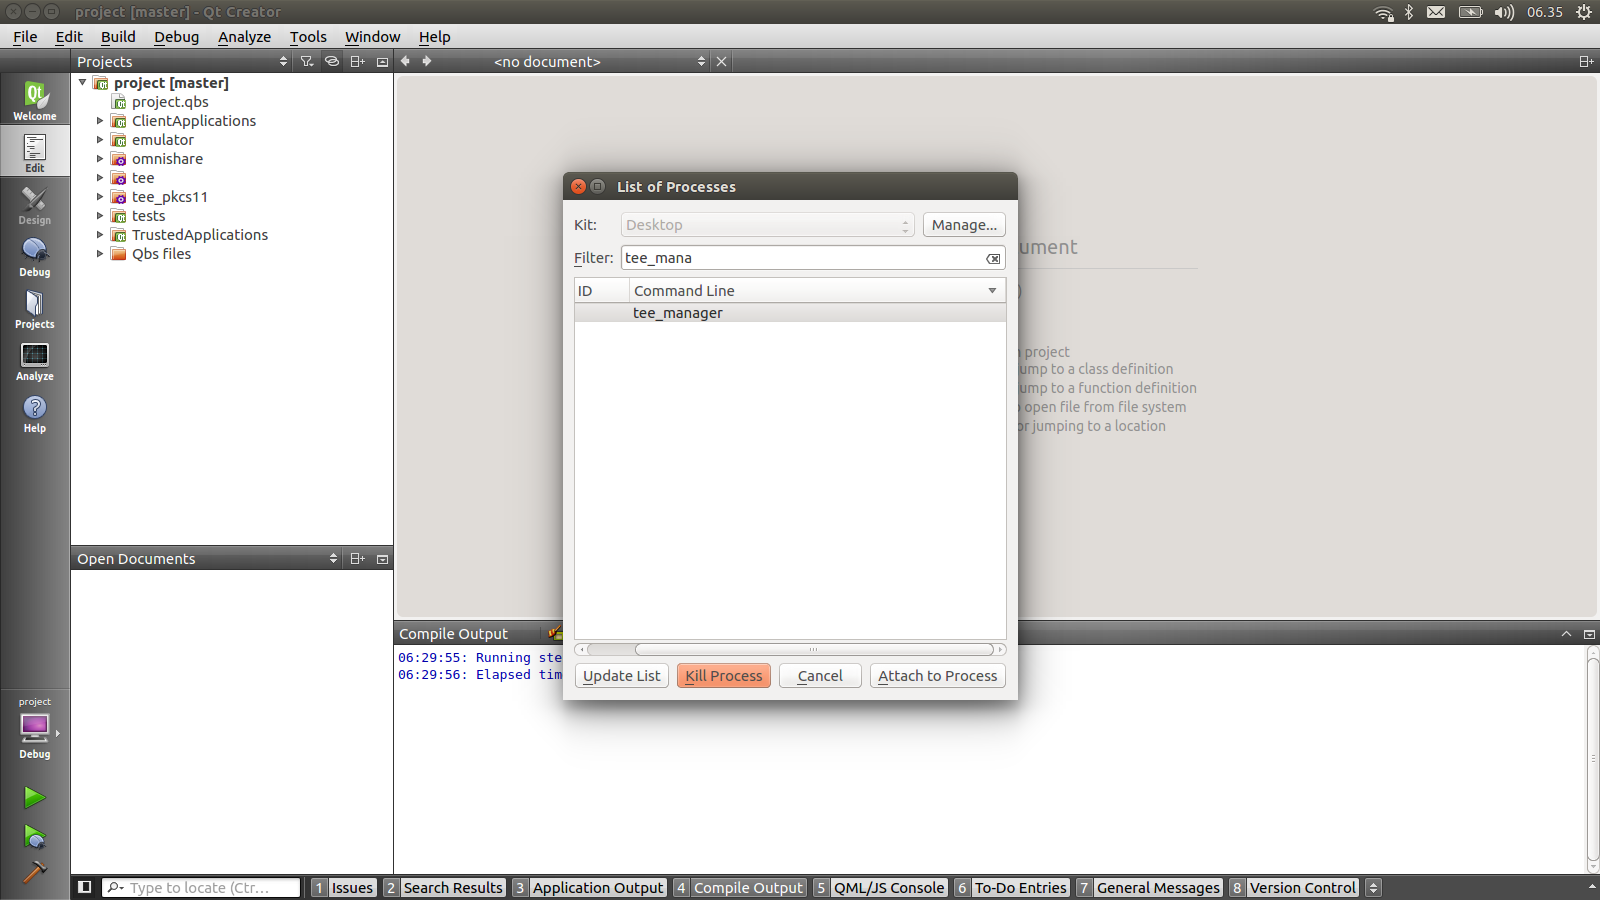
To stop opentee, kill the tee_manager process, select Debug > Start Debugging > Attach to running process. Then search for the process to kill:
Debugging with QtCreator
Debugging CAs
When debugging CAs, start by first selecting the project to be debugged as outlined above.
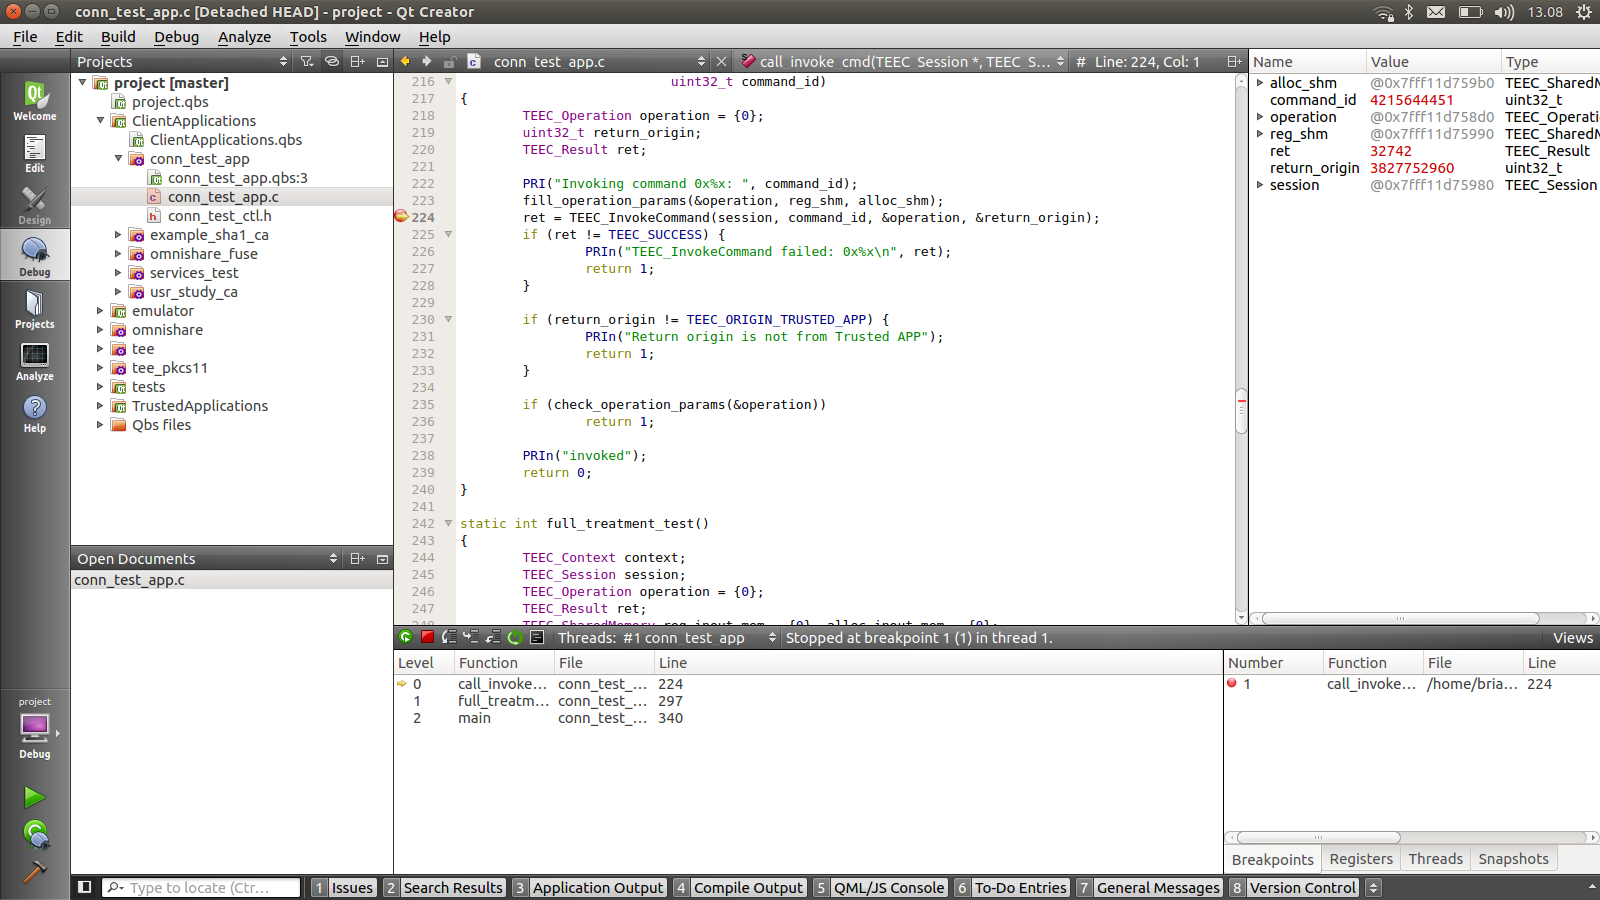
Then add a breakpoint to the code:
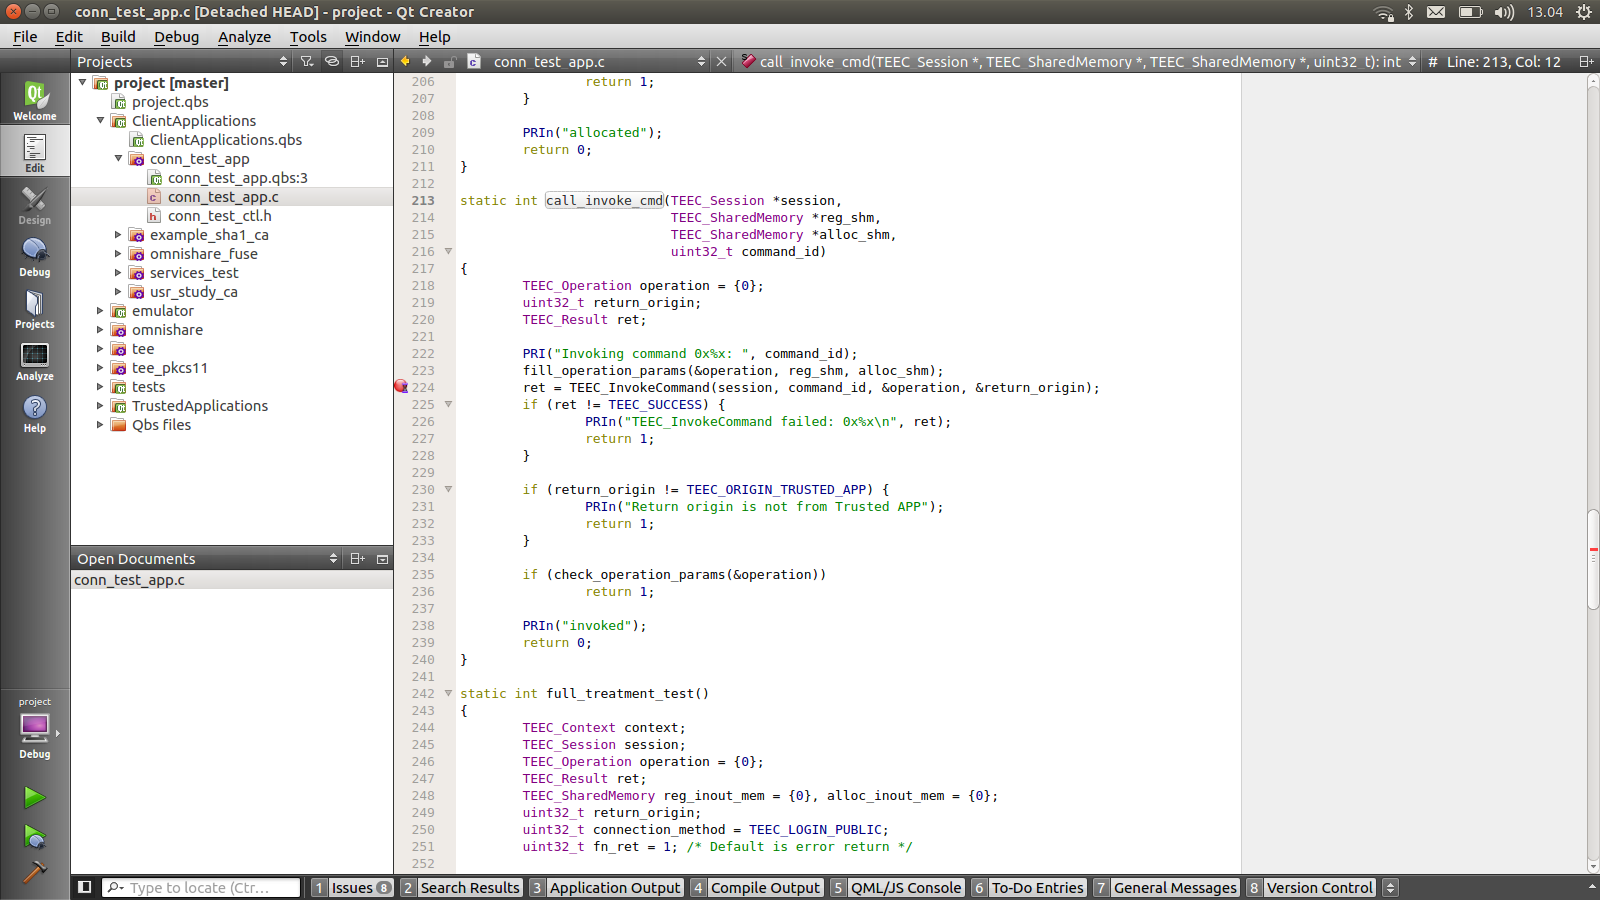
Then choose Debug > Start Debugging > Start debugging or click F5 and the code will break allowing you to step it and inspect the state.
Debugging TAs
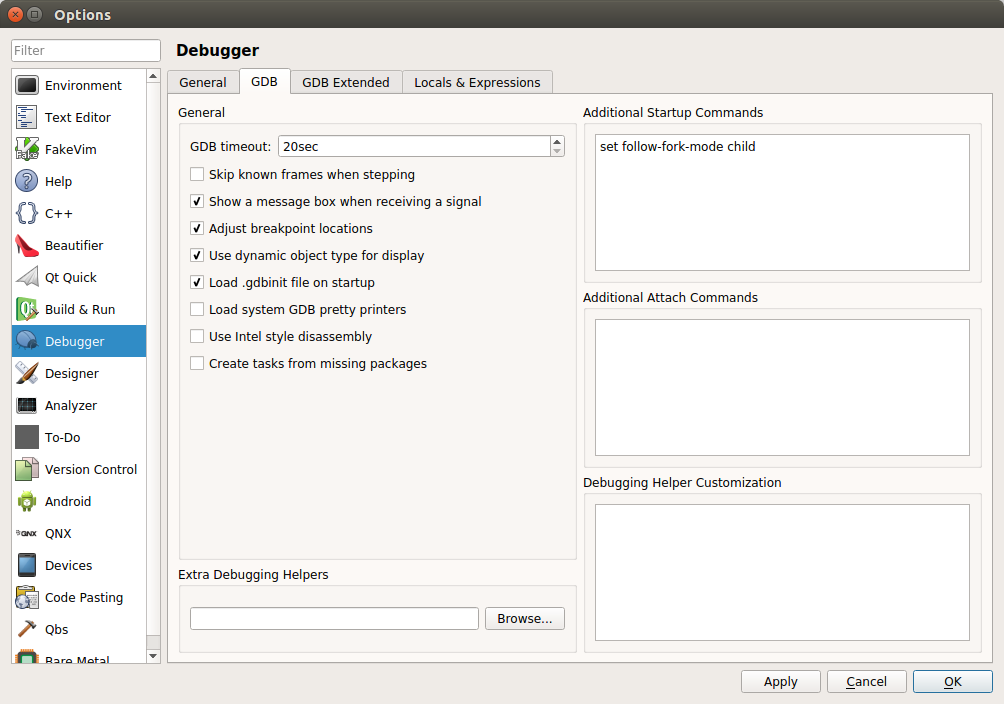
Start by configuring GDB Tools > Options > Debugger > GDB, add set follow-fork-mode child to the Additional Startup Commands:
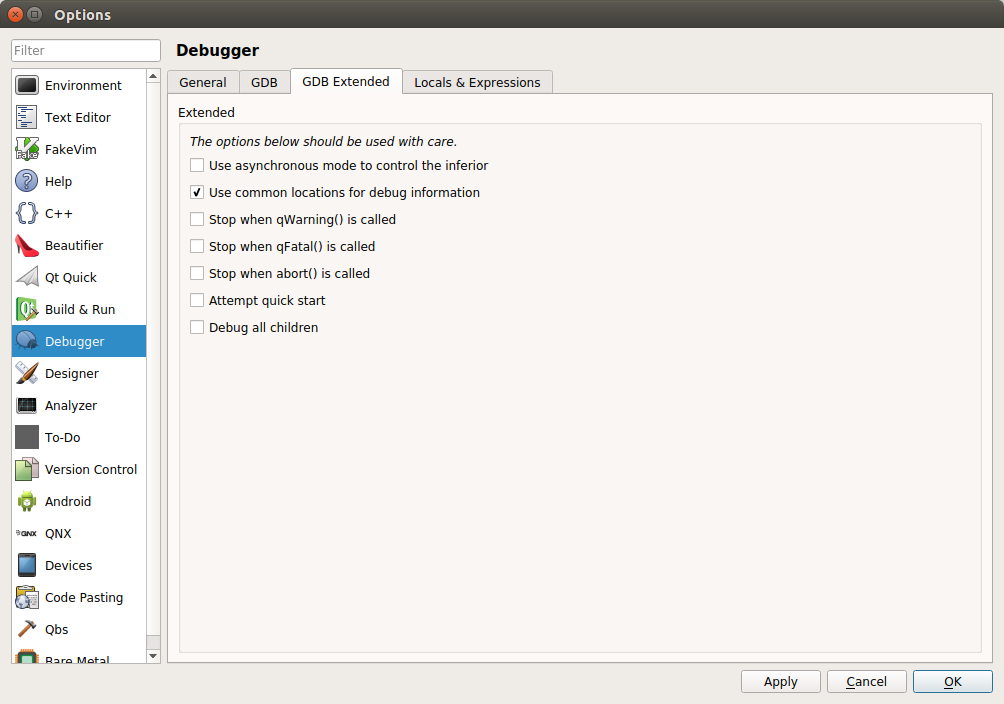
Then configure the GDB Extended Tools > Options > Debugger > GDB Extended, make sure to uncheck the Debug all children option. Without this change QtCreator will not hit breakpoints correctly!!
Debugging TA from creation
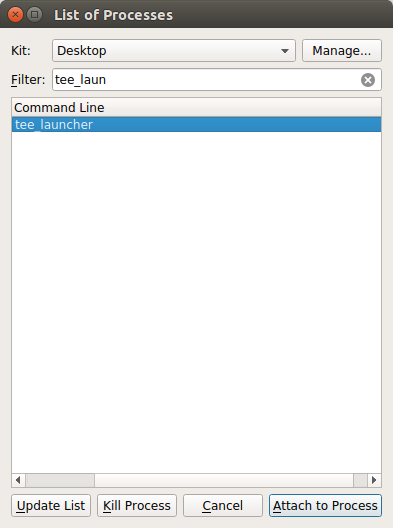
Because Open-TEE is a a daemon process that has a number of child processes it is best to run opentee-engine using Build > Run or Ctrl+R and only after that has started normally then attach to the tee_launcher process. tee_launcher is the process that is responsible for starting each TA process and so it is possible to use GDB to follow into the newly created TA process. Debug > Start Debugging > Attach to Running Application select tee_launcher:
After attaching to the tee_launcher process Continue the debugged process using either the debugger continue button or press F5. Open the TA that you wish to debug e.g. ta_conn_test_app insert the break points as you wish. Then using either another instance of QtCreator or from the command line start the corresponding CA e.g. conn_test_app. When the CA starts it will then cause the break point to be hit in the TA and you can step through the code as if debugging a normal application.
Caveat: We have noticed that once you stop the debugger in QtCreator, this kills the tee_launcher process. This means that you should stop and restart the opentee-engine before starting the next debugging session see Running and Stopping for more details.
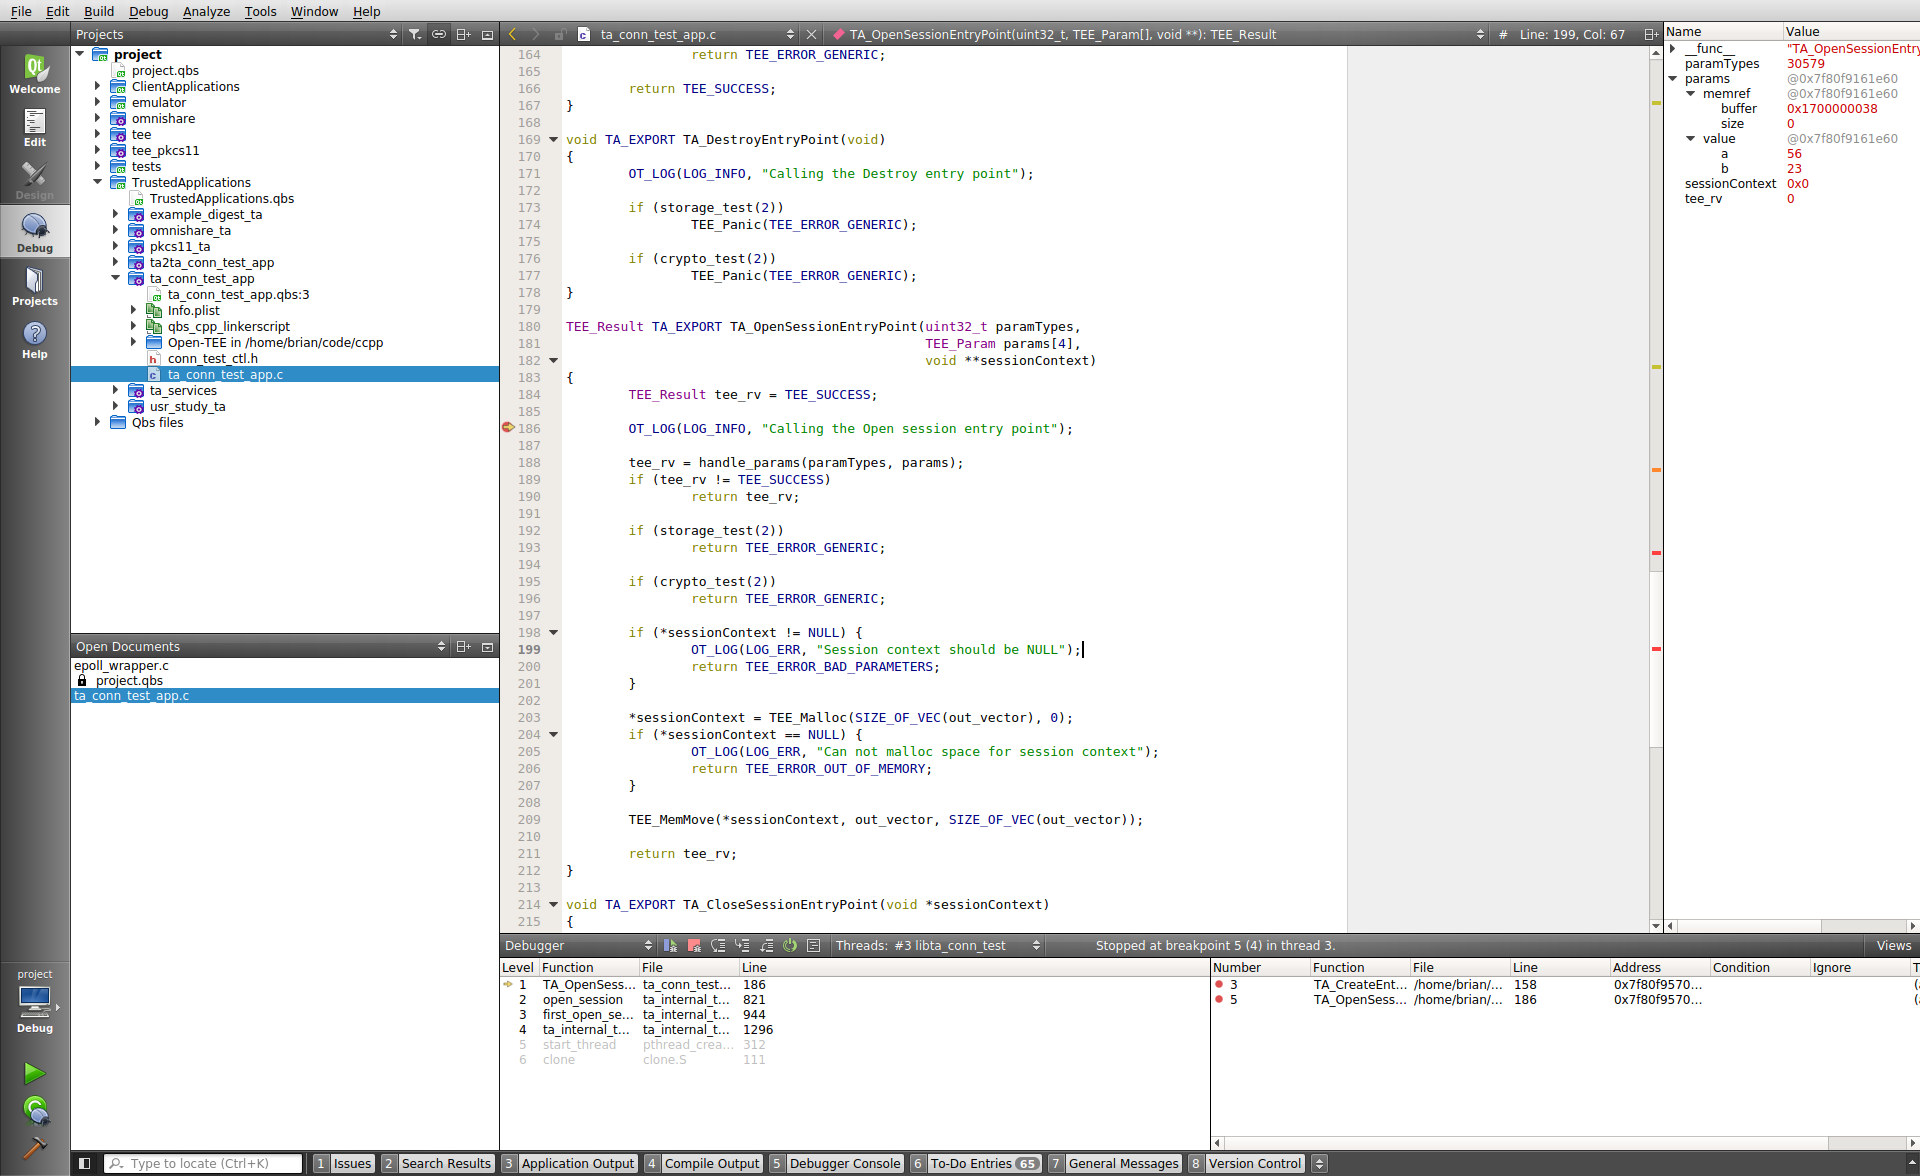
Debugging a Running TA
Start by attaching to the running TA process Debug > Start Debugging > Attach to running process, the TA process name is the name of the shared library that is created during the build process e.g. libta_conn_test_app.so.
Insert a breakpoint in the TA code and then invoke a client application to test and the breakpoint will be hit allowing the code to be inspected as with the CA.